Michigan still has a long climb back to prosperity
Governor Rick Snyder’s Michigan Dashboard and the Business Leaders for Michigan’s Economic Competitiveness Benchmarking Report both look at a wide range of factors to measure progress in our state. I want to look at the two big ‘elephants in the room” – income and educational attainment.
We’re hurting in both respects. The climb back to prosperity is long and steep – and too many state residents still lack the muscles for the slog up the hill.
First, let’s look at the income trends of Michigan residents.
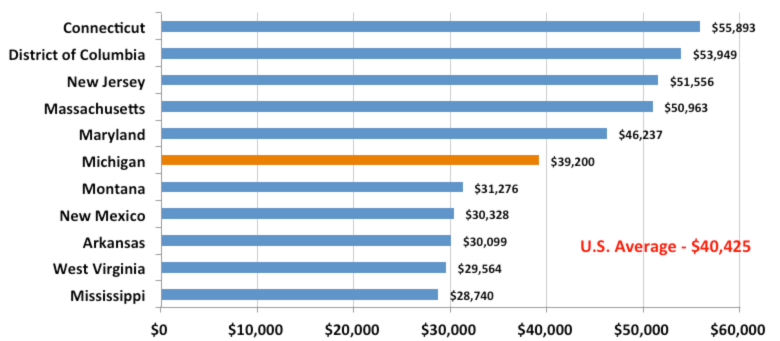
The first two charts below track personal income in 2000 and 2012. In both charts, I’ve placed Michigan in the middle, between the top five and bottom five states in the nation. In 2000, Michigan’s personal income of $39,200 ranked 19th, but slightly below the national average.
Figure 1. Ranking of States by 2000 Per Capita Personal Income (in $2012)
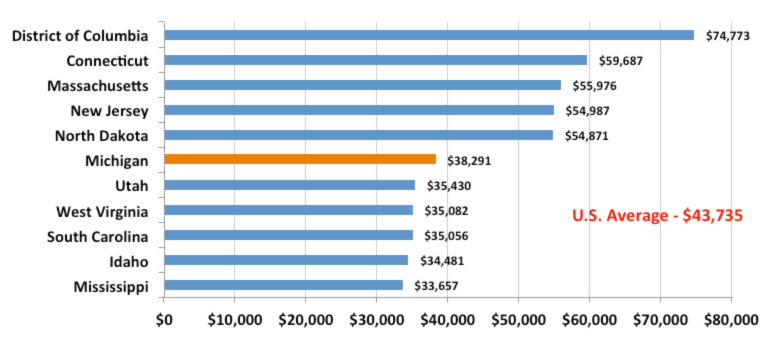
By 2012, Michigan had suffered a significant setback. The east coast, with the new oil-driven entry of North Dakota, took top honors, greatly extending their distance from Michigan. Michigan’s rank is now 37th and well below the national average. Michigan’s distance from the top 5 has more than doubled (a $16,580 gap) while its distance from the bottom 5 has been cut in half ($2,861 gap).
Figure 2. Ranking of States by 2012 Per Capita Personal Income (in $2012)
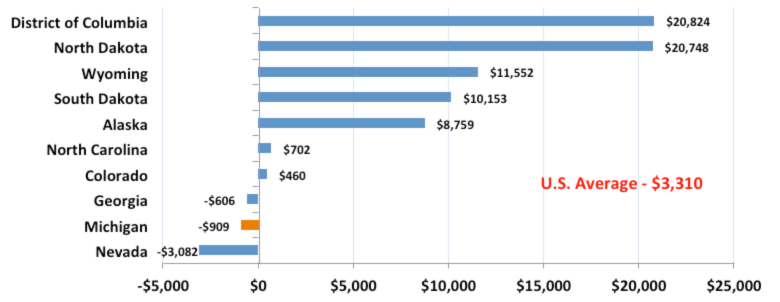
The next chart offers another glimpse of the change over the past decade or so. Michigan has experienced personal income increases in the last two years – that’s why the governor’s Dashboard currently gives a thumbs up on the measure of personal income. However, Michigan remains one of only three states that have lost ground on the personal income measure over the past dozen years.
Figure 3. Ranking of States by 2000 – 2012 Change in Per Capita Personal Income (in $2012)
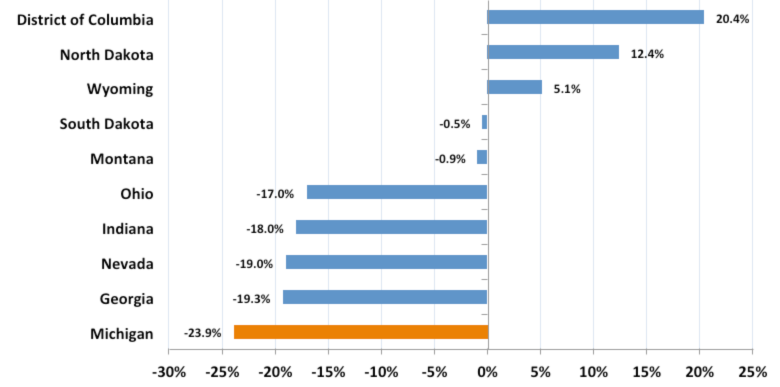
Finally, here’s one more look at the income trends. Figure 4 looks at median household income rather than personal income since Michigan’s high-flying economy at the end of the 20th century. In 1999, Michigan ranked 16th in the nation in median household income. In 2012, we ranked 34th. The buying power of Michigan households shrank 24 percent over that 13-year period – a worst-in-the-nation status.
Figure 4. Ranking of States by 1999 – 2012 Change in Median Household Income (in $2012)
While we know that the Great Recession hit the manufacturing states hardest, particularly those with the least industry diversification, we also have become aware that income follows closely with educational attainment – another indicator followed closely by both the governor’s Dashboard and Business Leaders for Michigan.
One of the major points made by the BLM Economic Competitiveness Benchmarking Report is that “Michigan’s talent production is good, but college attainment is low.” It goes on to say that “Michigan’s colleges confer a large number of degrees and award more “critical skills” degrees than most peer states.” However, “The percentage of the population with an associate’s degree or above is lower than “Top Ten” states,” and “Michigan’s talent deficit can be attributed, in part, to low numbers of degreed individuals migrating to the state.”
Back in 2000, when Michigan’s rankings on income were relatively good, we ranked poorly - 36th – in our number of college graduates. That disconnect was clearly the result of high-paying manufacturing jobs, particularly in the auto industry, that had minimal education requirements. The Michigan story clearly flew in the face of the notion of education driving income. The fact that many Michigan adults, when surveyed, did not see college education as critical for their children should have served as a clarion call for intervention.
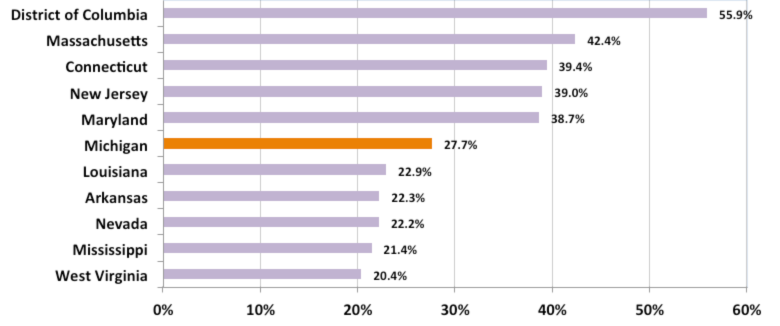
Figure 5. Ranking of States by Percent of Population with at Least a Bachelor’s Degree in 2012
The Great Recession’s impact on the manufacturing sector is clear. Overall employment took a huge hit and high wage/low education jobs disappeared. The return of the manufacturing sector, particularly automotive, has been marked by lower wage structures and increased requirements for education and technical skills. State government began to tout the importance of post-secondary education, but support for its public universities did not keep pace with states across the country. Many Michigan parents and students finally saw the writing on the wall but were faced with less than stellar public school systems and increasing college costs. Michigan’s college graduation rate rose from 23.9 to 27.7 percent between 2000 and 2012. We’ve moved up in the rankings, but only slightly, from 36th to 33rd place among the states.
While we are going in the right direction other states continue to outpace us - 31 states had a faster rate of college graduation growth than Michigan. I do need to mention that our community colleges continue to be one of our great strengths. In fact, Michigan ranks 17th in percentage of persons with an Associate’s degree (up slightly from 2000). It has been clearly demonstrated that a large share of the higher paying jobs of the future will require technical degrees. Our community colleges are working closely with employers to develop the programs that will meet their skill requirements.
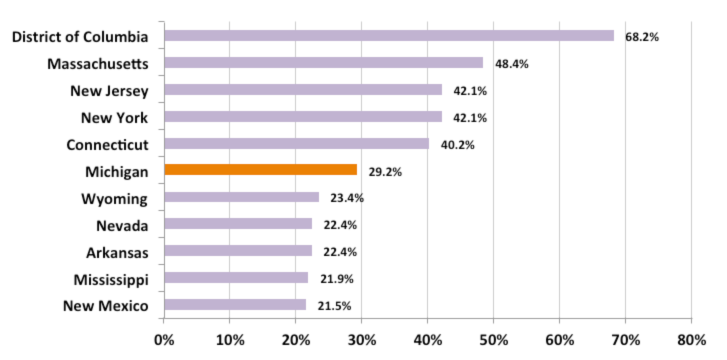
Using a universe of persons 25 years and over for measuring college graduation rates is often thought to penalize Michigan, due to its large base of residents who arrived here with minimal levels of education and worked in the booming manufacturing sector during and after World War II. The other side of the coin is that, while our colleges and universities are educating large numbers of individuals, Michigan does not do a good job in retention or attraction of educated “youth.” One way of dealing with these issues is to look at a subset of the 25 years and over population – specifically those 25 to 34 years of age. This is the group that has heard the education message – they signify the presence of a “talent” message that states need to be sending to attract and grow employment. In addition, this is an important component of the entrepreneurial class.
Figure 6 allows us to look at how well Michigan is doing with this younger group of adults. Michigan ranks 31st, tied with South Dakota. We continue to be 11.0 percentage points behind the top 5.
Figure 6. Ranking of States by Percent of Population, 25-34 Years, with at Least a Bachelor’s Degree in 2012
While dashboards show Michigan increasing in the critical areas of educational attainment and income, we appear to be doing no more than treading water in the national context. While education has been identified as key to Michigan’s future, I am not sure that we are all rowing together in this boat. This should be Job 1, driven by a coordinated, all out statewide effort from birth to college graduation and beyond. While we keep saying the right things (Talking the Talk), we don’t appear to be quite ready for concerted action (Walking the Walk).
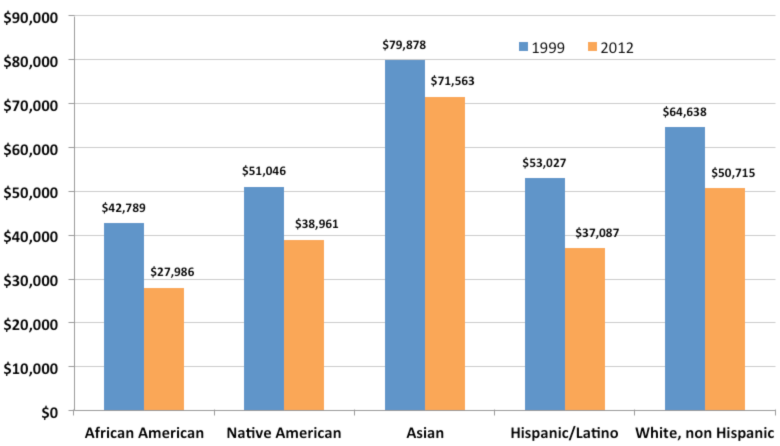
Finally, this effort must be grounded in equity. Michigan’s recent declines in income and buying power fell hardest on communities of color. African Americans saw their household income drop by 34.6 percent to just $27,986, while Latinos lost 30.1 percent of their buying power. Asian households fared best, followed by whites. This can be attributed to their higher levels of college completion and the higher average number of workers in their households.
Figure 7. Median Household Income by Race/Ethnicity of Householder, 1999 – 2012 (in $2012)
Business Watch
Covering the intersection of business and policy, and informing Michigan employers and workers on the long road back from coronavirus.
- About Business Watch
- Subscribe
- Share tips and questions with Bridge Business Editor Paula Gardner
Thanks to our Business Watch sponsors.
Support Bridge's nonprofit civic journalism. Donate today.
See what new members are saying about why they donated to Bridge Michigan:
- “In order for this information to be accurate and unbiased it must be underwritten by its readers, not by special interests.” - Larry S.
- “Not many other media sources report on the topics Bridge does.” - Susan B.
- “Your journalism is outstanding and rare these days.” - Mark S.
If you want to ensure the future of nonpartisan, nonprofit Michigan journalism, please become a member today. You, too, will be asked why you donated and maybe we'll feature your quote next time!


 Source: Bureau of Economic Analysis (BEA)
 Source: Bureau of Economic Analysis (BEA)
 Source: Bureau of Economic Analysis (BEA)
 Source: Census Bureau – Decennial Census and American Community Survey
 Source: Census Bureau – 2012 American Community Survey
 Source: Census Bureau – 2012 American Community Survey
 Source: Census Bureau – Decennial Census and American Community Survey