New century brings change to Michigan’s gender competition
On gender, the statistics always have been clear.
More male babies are born than female babies – about 104 or 105 males per 100 females, in fact.
Women, though have their own advantage: longer lifespans. At age 65, there are 108 females per 100 males; by age 80, the ratio is 143 females per 100 males.
But, in recent years, the stats are showing something surprising on the gender front: change. In particular, change in the age at which the male advantage at birth is lost.
The U.S. Census Bureau released new age and race/ethnic estimates for states and counties last week. While I was preparing a brief analysis on age structure by race/ethnicity (keep an eye out for it in future editions of Bridge), I came across a table on single years of age by gender. The age at which women take over in number appeared to me to be higher than I remembered, so I decided to do a little research.
Much to my surprise, I found that I was somewhat mistaken. Even those of us who do this demographic thing on a daily basis can be surprised.
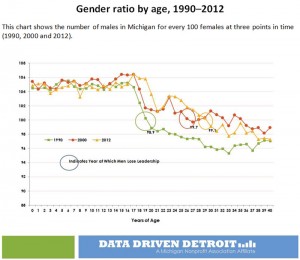
I started back in 1940 because that was the earliest Census report I had on my shelves. At that time, Michigan males outnumbered Michigan females through the age of 18 years. Women took the lead from men at 19 years of age and never relinquished it. This pattern was replicated in the censuses of 1950, 1960, 1970 and 1980. The first change was found to occur in 1990 (see chart at right) when 19-year-old males outnumbered 19-year-old females. This was not a great surprise, although the length of time to get to this point was. Increasing male longevity was resulting not just from men living to older ages, but also from increasing numbers living through their teens.
However, the 2000 results threw gender and age patterns out of the proverbial window. With slight exceptions (27 and 33 years of age), men held their ground all the way through age 35! What can account for this monumental shift? Increasing longevity is not the answer. Early death rates – teens and early 20s – were still much higher for men. Perhaps it was another outcome of the large stream of immigrants coming to Michigan during the decade – both for permanent residence as well as on student and work visas. This increasing trend favored males over females and concentrated in the age range of 20 to 39.
I would love to hear theories from readers on this.
The release of new 2012 data last week caused me to start this excavation, so let’s move on to 2010 and 2012 data. The 2010 Census ratcheted the dividing line back to 29 years of age. While the 2000 data included some backsliding prior to the official changeover at 36, the 2010 distribution was clear in that men lost their advantage at 29 and never regained it. Why the drop? Perhaps it was immigration-based as well, as numbers showed a significant drop from the previous decade. Estimates for 2012 have given us one more year and a three-decade advantage.
Women have made great strides over the last few decades in the areas of education and employment. These strides have been accompanied by a declining birth rate, more women smokers and more stress. Men have experienced a higher percentage increase in longevity than women in recent years.
While our odds of catching up with women in our later years is not in the cards, I anticipate that we may continue to see a steady rise in the age at which we lose the advantage. As an aging baby boomer male, I am happy with the odds that I have to look at over the years to come.
See what new members are saying about why they donated to Bridge Michigan:
- “In order for this information to be accurate and unbiased it must be underwritten by its readers, not by special interests.” - Larry S.
- “Not many other media sources report on the topics Bridge does.” - Susan B.
- “Your journalism is outstanding and rare these days.” - Mark S.
If you want to ensure the future of nonpartisan, nonprofit Michigan journalism, please become a member today. You, too, will be asked why you donated and maybe we'll feature your quote next time!


 CLICK TO ENLARGE
 Kurt Metzger is director of Data Driven Detroit, a nonprofit in Detroit established by foundations to build greater capacity for people to work together, and improve lives and communities affiliated with the Michigan Nonprofit Association. He was research director for United Way for Southeastern Michigan from 2005 to 2008 and before that, was a director at the Center for Urban Studies at Wayne State University.