Interactive graphic: See college acceptance rates at YOUR school

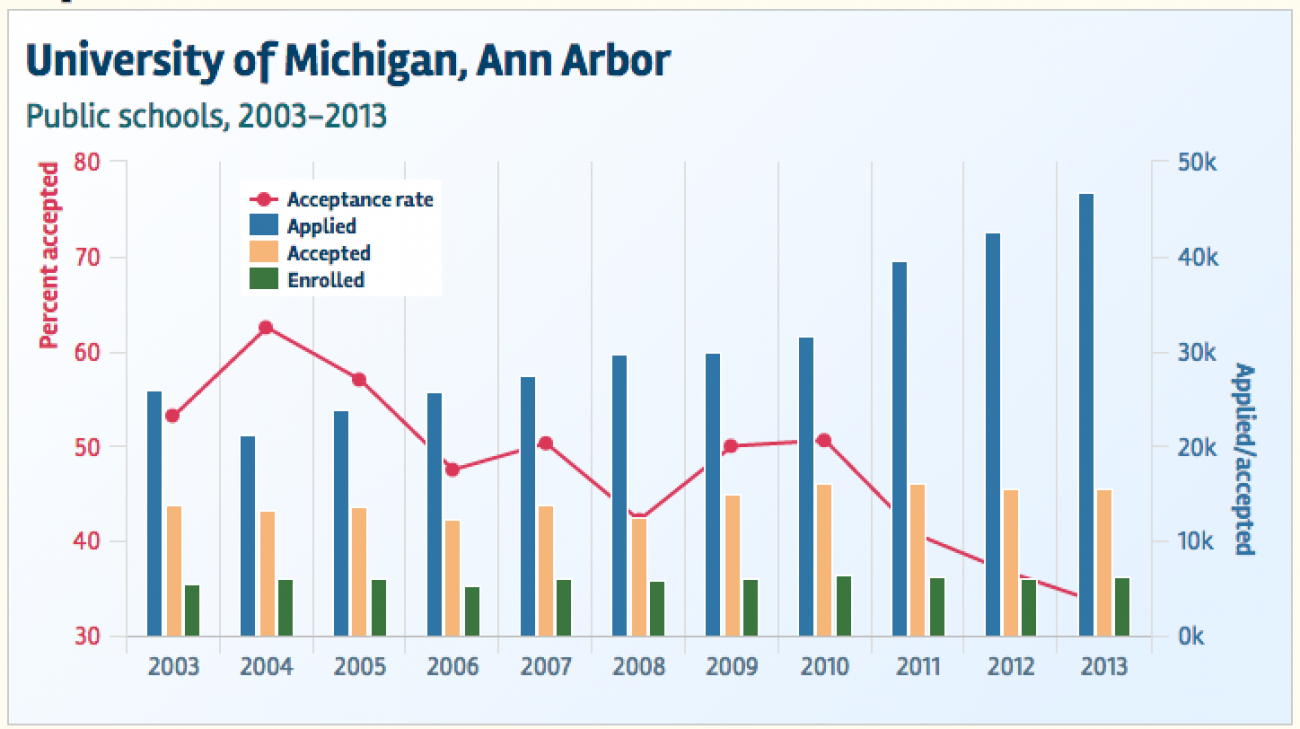
Deadlines are approaching, and most Michigan colleges and universities are getting more and more applications for enrollment, even though the number of high school seniors in the state is decreasing. That’s because students are applying to more schools than they used to, causing the admission rates at a lot of colleges and universities to plummet. Click on a school to see how it has done over the past decade.
CMU EMU Ferris
Grand Valley
Lake Superior
MSU
Michigan Tech
NMU
Oakland
Saginaw Valley
UM-Ann Arbor
UM-Dearborn
UM-Flint
Wayne State
WMU
Adrian
Albion
Alma
Andrews
Aquinas
Calvin
Coll. Creative Studies
Concordia
Cornerstone
Davenport
Finlandia
Hope
Kalamazoo
Kettering
Lawrence Tech
Madonna
Marygrove
Northwood
Olivet
Siena Heights
Spring Arbor
Univ. Detroit-Mercy
Changes in acceptance rates among Michigan schools
Most colleges across Michigan, both public and private, have seen a marked increase in applications, which has lowered acceptance rates. Table is sorted by 2013 acceptance rate.
| Public school | Applications, 2013 | Change from 2003 | Acceptance rate, 2003 | Acceptance rate, 2013 |
|---|---|---|---|---|
| UM-Ann Arbor | 46813 | 80.4% | 53.2% | 33.3% |
| UM-Dearborn | 4908 | 84.0% | 66.4% | 62.8% |
| Central Michigan | 19262 | 42.8% | 70.4% | 63% |
| Eastern Michigan | 11929 | 33.3% | 74.2% | 64% |
| Oakland | 12019 | 90.1% | 80.4% | 66% |
| Michigan State | 31479 | 26.1% | 70.8% | 68.6% |
| Northern Michigan | 6743 | 51.2% | 84.3% | 73.1% |
| Ferris State | 10718 | -12.0% | 73.5% | 75.9% |
| Wayne State | 11524 | 67.5% | 70.1% | 76.2% |
| Michigan Tech | 4520 | 52.9% | 91.8% | 76.6% |
| UM-Flint | 3003 | 169.8% | 81% | 78.1% |
| Saginaw Valley State | 6057 | 80.0% | 89.5% | 78.7% |
| Grand Valley State | 18122 | 49.2% | 73% | 82.6% |
| Western Michigan | 14621 | -3.2% | 82.3% | 82.8% |
| Lake Superior State | 1481 | -5.5% | 89% | 91.8% |
| Private school | Applications, 2013 | Change from 2003 | Acceptance rate, 2003 | Acceptance rate, 2013 |
|---|---|---|---|---|
| Andrews University | 2551 | 163.3% | 60.4% | 37.5% |
| Lawrence Technological University | 1819 | 28.4% | 76.3% | 43.7% |
| College for Creative Studies | 1284 | 170.9% | 74.3% | 48.6% |
| Olivet College | 1995 | 105.2% | 59.1% | 51.5% |
| Concordia University-Ann Arbor | 1150 | 254.9% | 74.4% | 53.7% |
| Adrian College | 4675 | 259.6% | 87.9% | 56.3% |
| Albion College | 4430 | 188.8% | 86.8% | 56.4% |
| Finlandia University | 872 | n/a | n/a | 58.8% |
| Madonna University | 1089 | 61.8% | 86% | 61.2% |
| University of Detroit Mercy | 3670 | 68.3% | 81.1% | 61.5% |
| Kettering University | 2140 | -17.1% | 57.2% | 61.6% |
| Spring Arbor University | 2698 | 217.4% | 85.9% | 65% |
| Northwood University-Michigan | 1447 | -18.5% | 83.8% | 65.4% |
| Kalamazoo College | 2528 | 57.7% | 70.3% | 66.9% |
| Siena Heights University | 1422 | 45.3% | 64.5% | 67.7% |
| Alma College | 2699 | 86.8% | 79% | 67.9% |
| Cornerstone University | 2349 | 82.8% | 75.7% | 68.1% |
| Calvin College | 4003 | 107.1% | 98.6% | 69.7% |
| Aquinas College | 2789 | 104.9% | 79.2% | 71.4% |
| Hope College | 4161 | 67.7% | 82.9% | 72.5% |
| Davenport University | 1385 | n/a | n/a | 91.7% |
| Marygrove College | 916 | 199.3% | 91.8% | 93.8% |
Source: National Center for Education Statistics
Michigan Education Watch
Michigan Education Watch is made possible by generous financial support from:
Subscribe to Michigan Education Watch
See what new members are saying about why they donated to Bridge Michigan:
- “In order for this information to be accurate and unbiased it must be underwritten by its readers, not by special interests.” - Larry S.
- “Not many other media sources report on the topics Bridge does.” - Susan B.
- “Your journalism is outstanding and rare these days.” - Mark S.
If you want to ensure the future of nonpartisan, nonprofit Michigan journalism, please become a member today. You, too, will be asked why you donated and maybe we'll feature your quote next time!


