Guest column: Another perspective on ranking ‘valuable’ schools

By Jeff Padden/Public Policy Associates
Bridge Magazine published an analysis of the Value-Added Matrix scores for 560 school districts in Michigan, including 52 charter schools and 508 traditional public schools. The VAM scores attempt to correct for differences among the student bodies in schools by looking at the socioeconomic condition of the district, a factor known to affect student achievement.
While there is substantial controversy about the method, the goal is worthy: We should not always judge the outcomes of a poor district by the same absolute standards as we do a school in a wealthy district. Instead, we should look at whether schools meet, exceed or fall short of their expected results.
State Champs: See how your district ranks.
This, of course, includes a trap for students. A school with very low expected results may achieve precisely those results, but, while parents and students might feel good about that, the graduates will still not be able to succeed in higher education or in competing for jobs. Godwin Heights Public Schools, cited in the Bridge coverage, is a clear example.
While the Bridge article stated that “only 6 percent of its juniors were considered ‘college ready’ on their ACTs in 2012,” it was the top ranked traditional district in the state. That, however, is an issue for another day. For now, it is enough to say that all simplistic means of ranking or rating school performance have significant limitations.
What is worth looking at in the VAM rankings is how schools are distributed throughout the list. Much has been made of the fact that three of the top five schools are charters. Yet, seven of the top 10 are traditional public schools. And, four of the bottom five are charters, but six of the bottom 10 are traditionals.
So, which type is really doing better by this VAM measure?
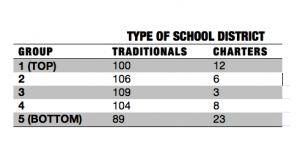
That can be answered by looking at how the two types of schools are distributed throughout the list. One way to do so is to divide the list into five equal segments from top to bottom. If the two types performed equally well, we would expect them to be proportionally represented in each of those five groups, with about 102 traditionals and 10 charters in each group. The actual distribution is quite different, especially for charters, as the table shows.
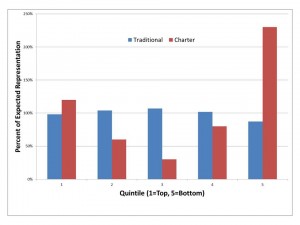
To correct for the much larger number of traditionals, the bar chart at right shows how the actual results are different from a proportional distribution. A value of 100 percent means that a district is represented in the group exactly as expected; 50 percent means that it is half represented.
The chart vividly shows that, while charters and traditionals are almost equally represented in the top group, charters are much less likely to show up in the middle. Most surprising is that they are more than twice as likely to be in the bottom group than would be expected.
Keep in mind, this is after the rankings have been corrected for the socioeconomic status of the district; poor districts are pushed upward by the VAM ranking method. So, a low-ranked poor school must perform exceptionally badly to land in the bottom group. The fact is that 39 percent of charters in the bottom group have more than 70 percent low socioeconomic status students, while only 16 percent of traditionals have poverty rates that high.
This should be a matter of grave concern to policy-makers and charter school authorizers.
This distribution of school performance is consistent with research by my firm, Public Policy Associates, Inc., from a dozen years ago. At that time, our national study of employer-linked charter schools concluded that the range of performance was wider than for traditional public schools; even then, charters were present at both extremes.
As a product of public schools, the father of children in public schools and as a board member of a charter operating company and former charter school board member, my perspective covers both sides of this street. Most Michiganians, including me, want to see the best possible results for our kids. Too often beliefs, rather than good analysis, drive that debate. We should all hope that the VAM rankings and other measurement tools can be looked at objectively rather than being skewed by either side.
Jeff Padden is the founder and president of Public Policy Associates, a Lansing-based research firm.
See what new members are saying about why they donated to Bridge Michigan:
- “In order for this information to be accurate and unbiased it must be underwritten by its readers, not by special interests.” - Larry S.
- “Not many other media sources report on the topics Bridge does.” - Susan B.
- “Your journalism is outstanding and rare these days.” - Mark S.
If you want to ensure the future of nonpartisan, nonprofit Michigan journalism, please become a member today. You, too, will be asked why you donated and maybe we'll feature your quote next time!


