
Are you picking Kentucky to win it all? Sure, the Wildcats may be undefeated on the court, but in Bridge Magazine’s bracket, Kentucky loses in the first round.
March Madness? No, it’s March Gradness.
What if people filled stadiums to cheer academic achievement? What if the college cutting down the nets was the school that gives low-income students the biggest break on tuition? Graduated the highest percentage of students? Or practiced gender pay equity?
Using federal data available from the Integrated Post-Secondary Education Data System, Bridge created brackets illustrating how the NCAA men’s basketball tournament teams, announced Sunday, would fare if games were decided by factors more important than throwing a ball through a hoop.
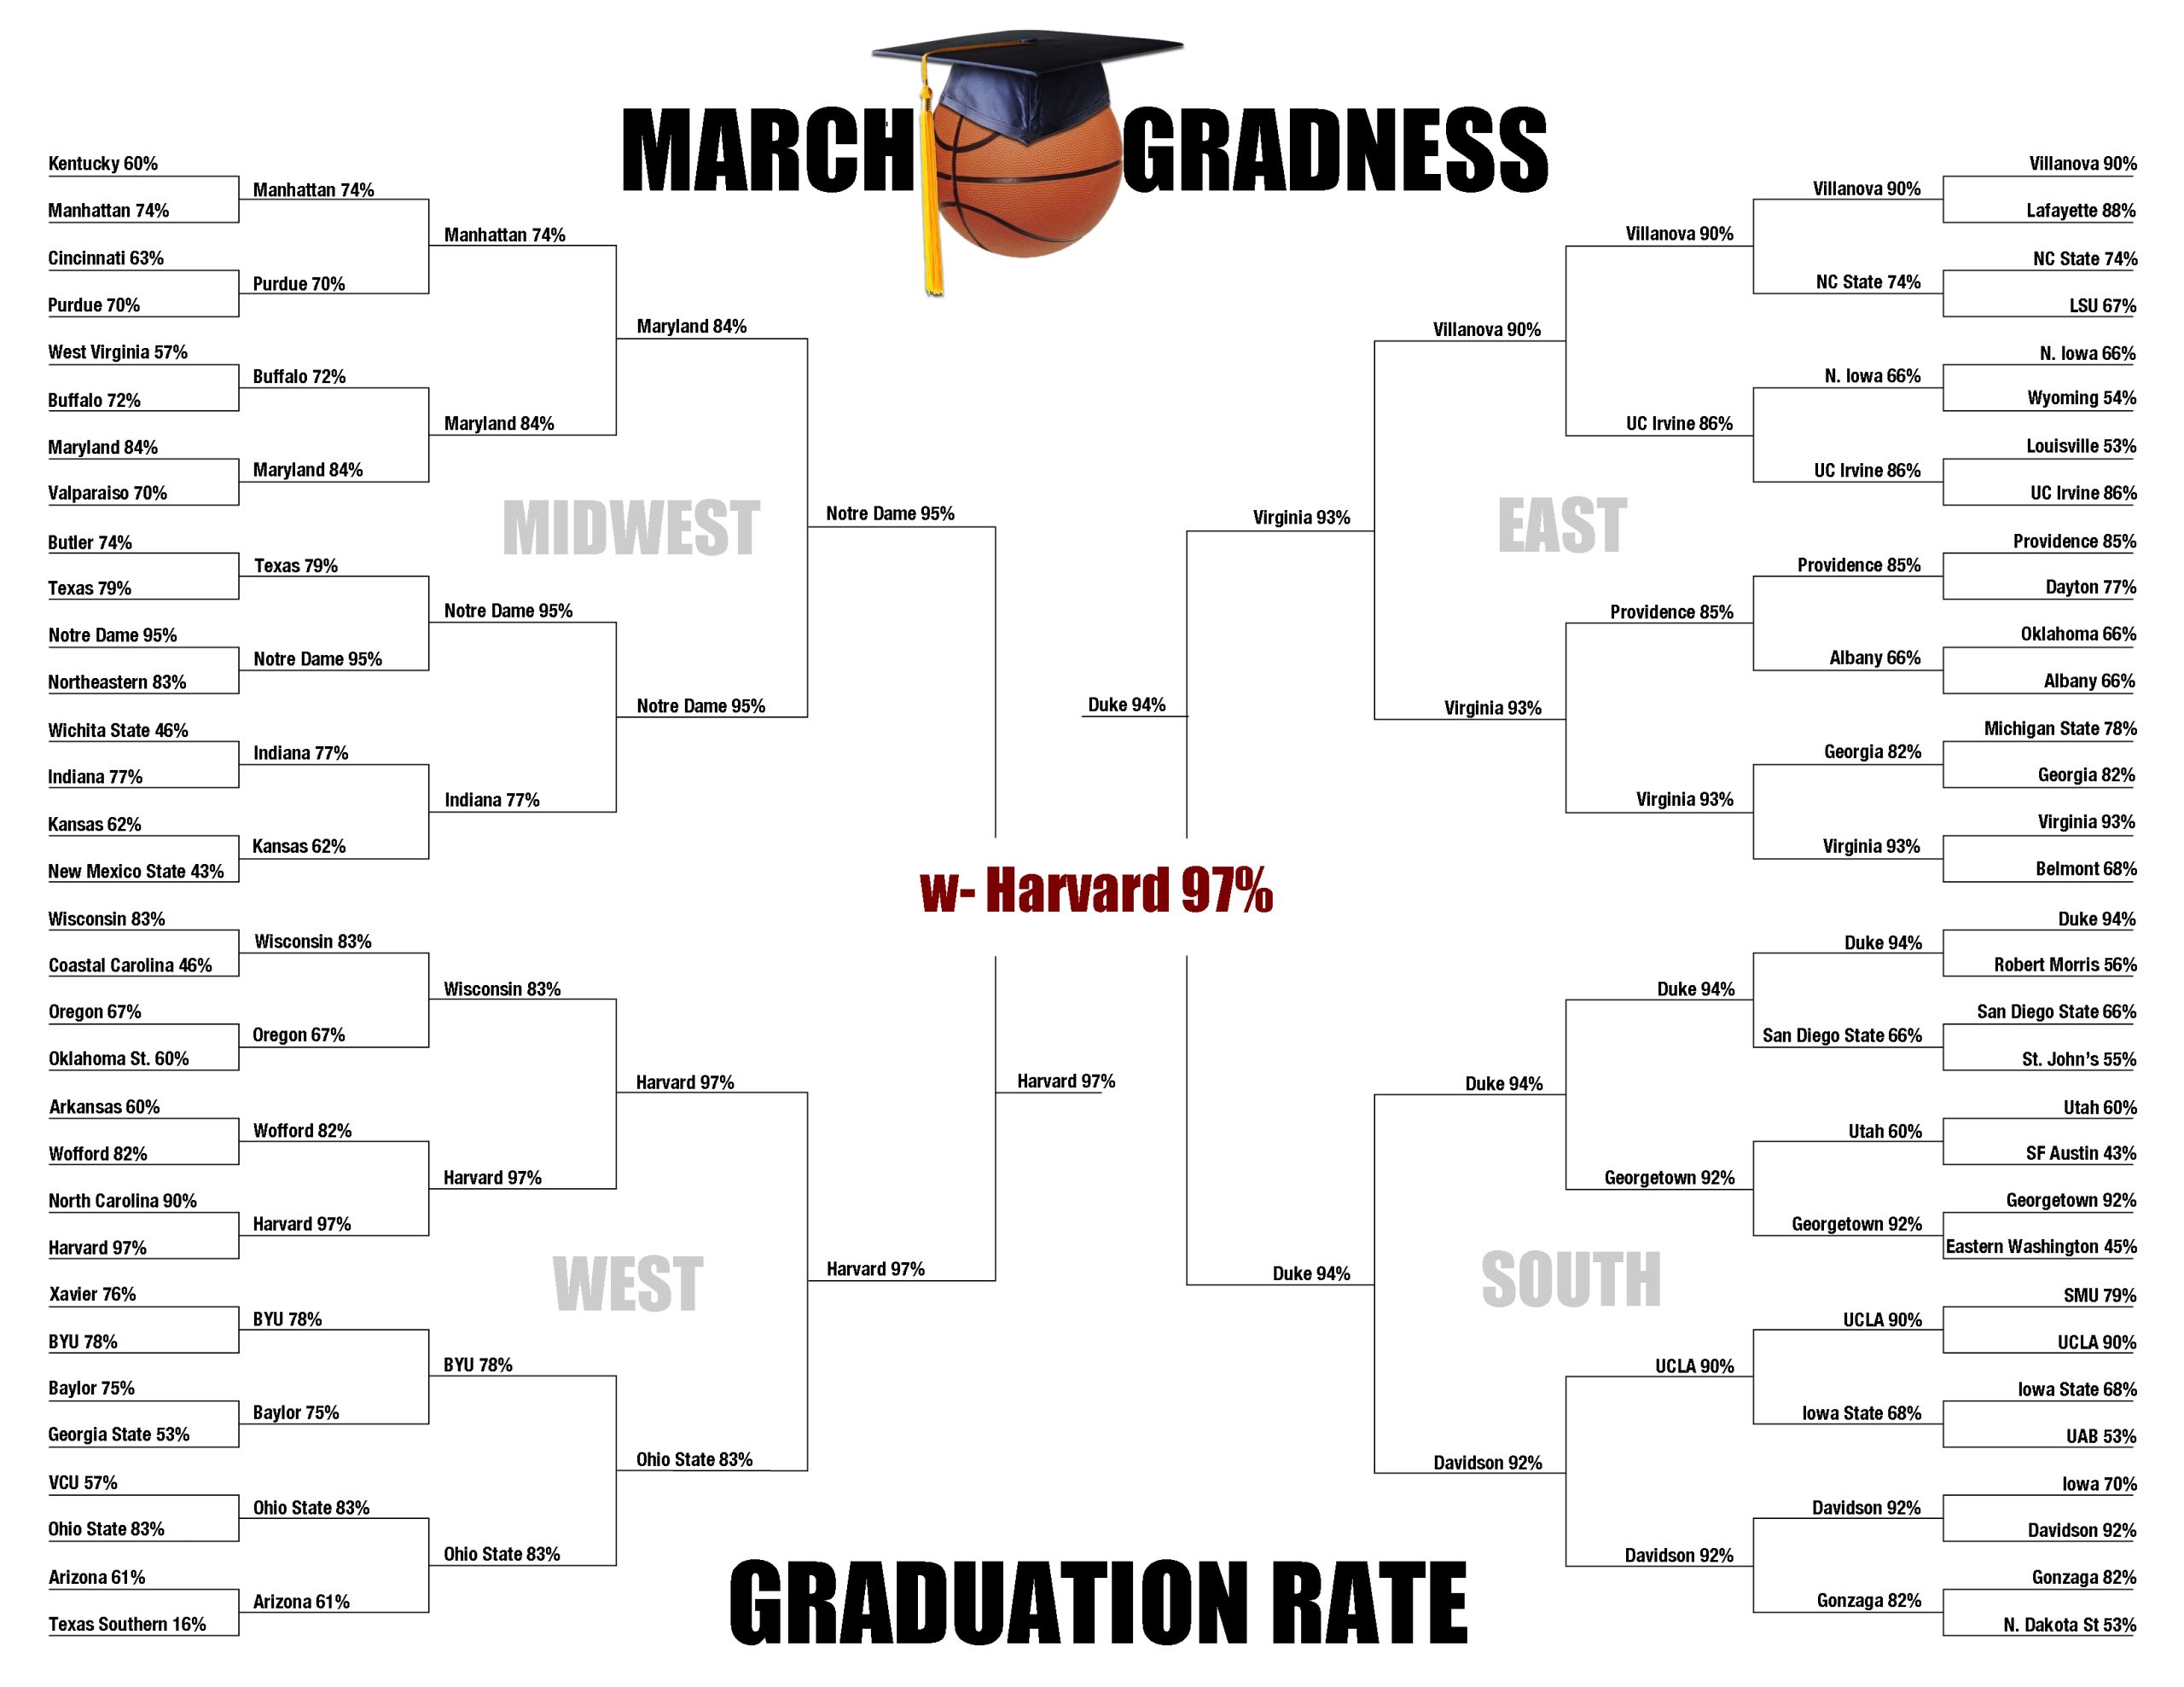
Based on all-campus graduation rates (the percent of students who earn a bachelor’s degree within six years), Harvard (97 percent) pounds Virginia (93 percent) in the national championship game. Notre Dame (95 percent) and Duke (92 percent) also made the Final Four.
Michigan State, the state’s only NCAA tournament team this year, lost in the first round to Georgia, 78 percent to 82 percent.
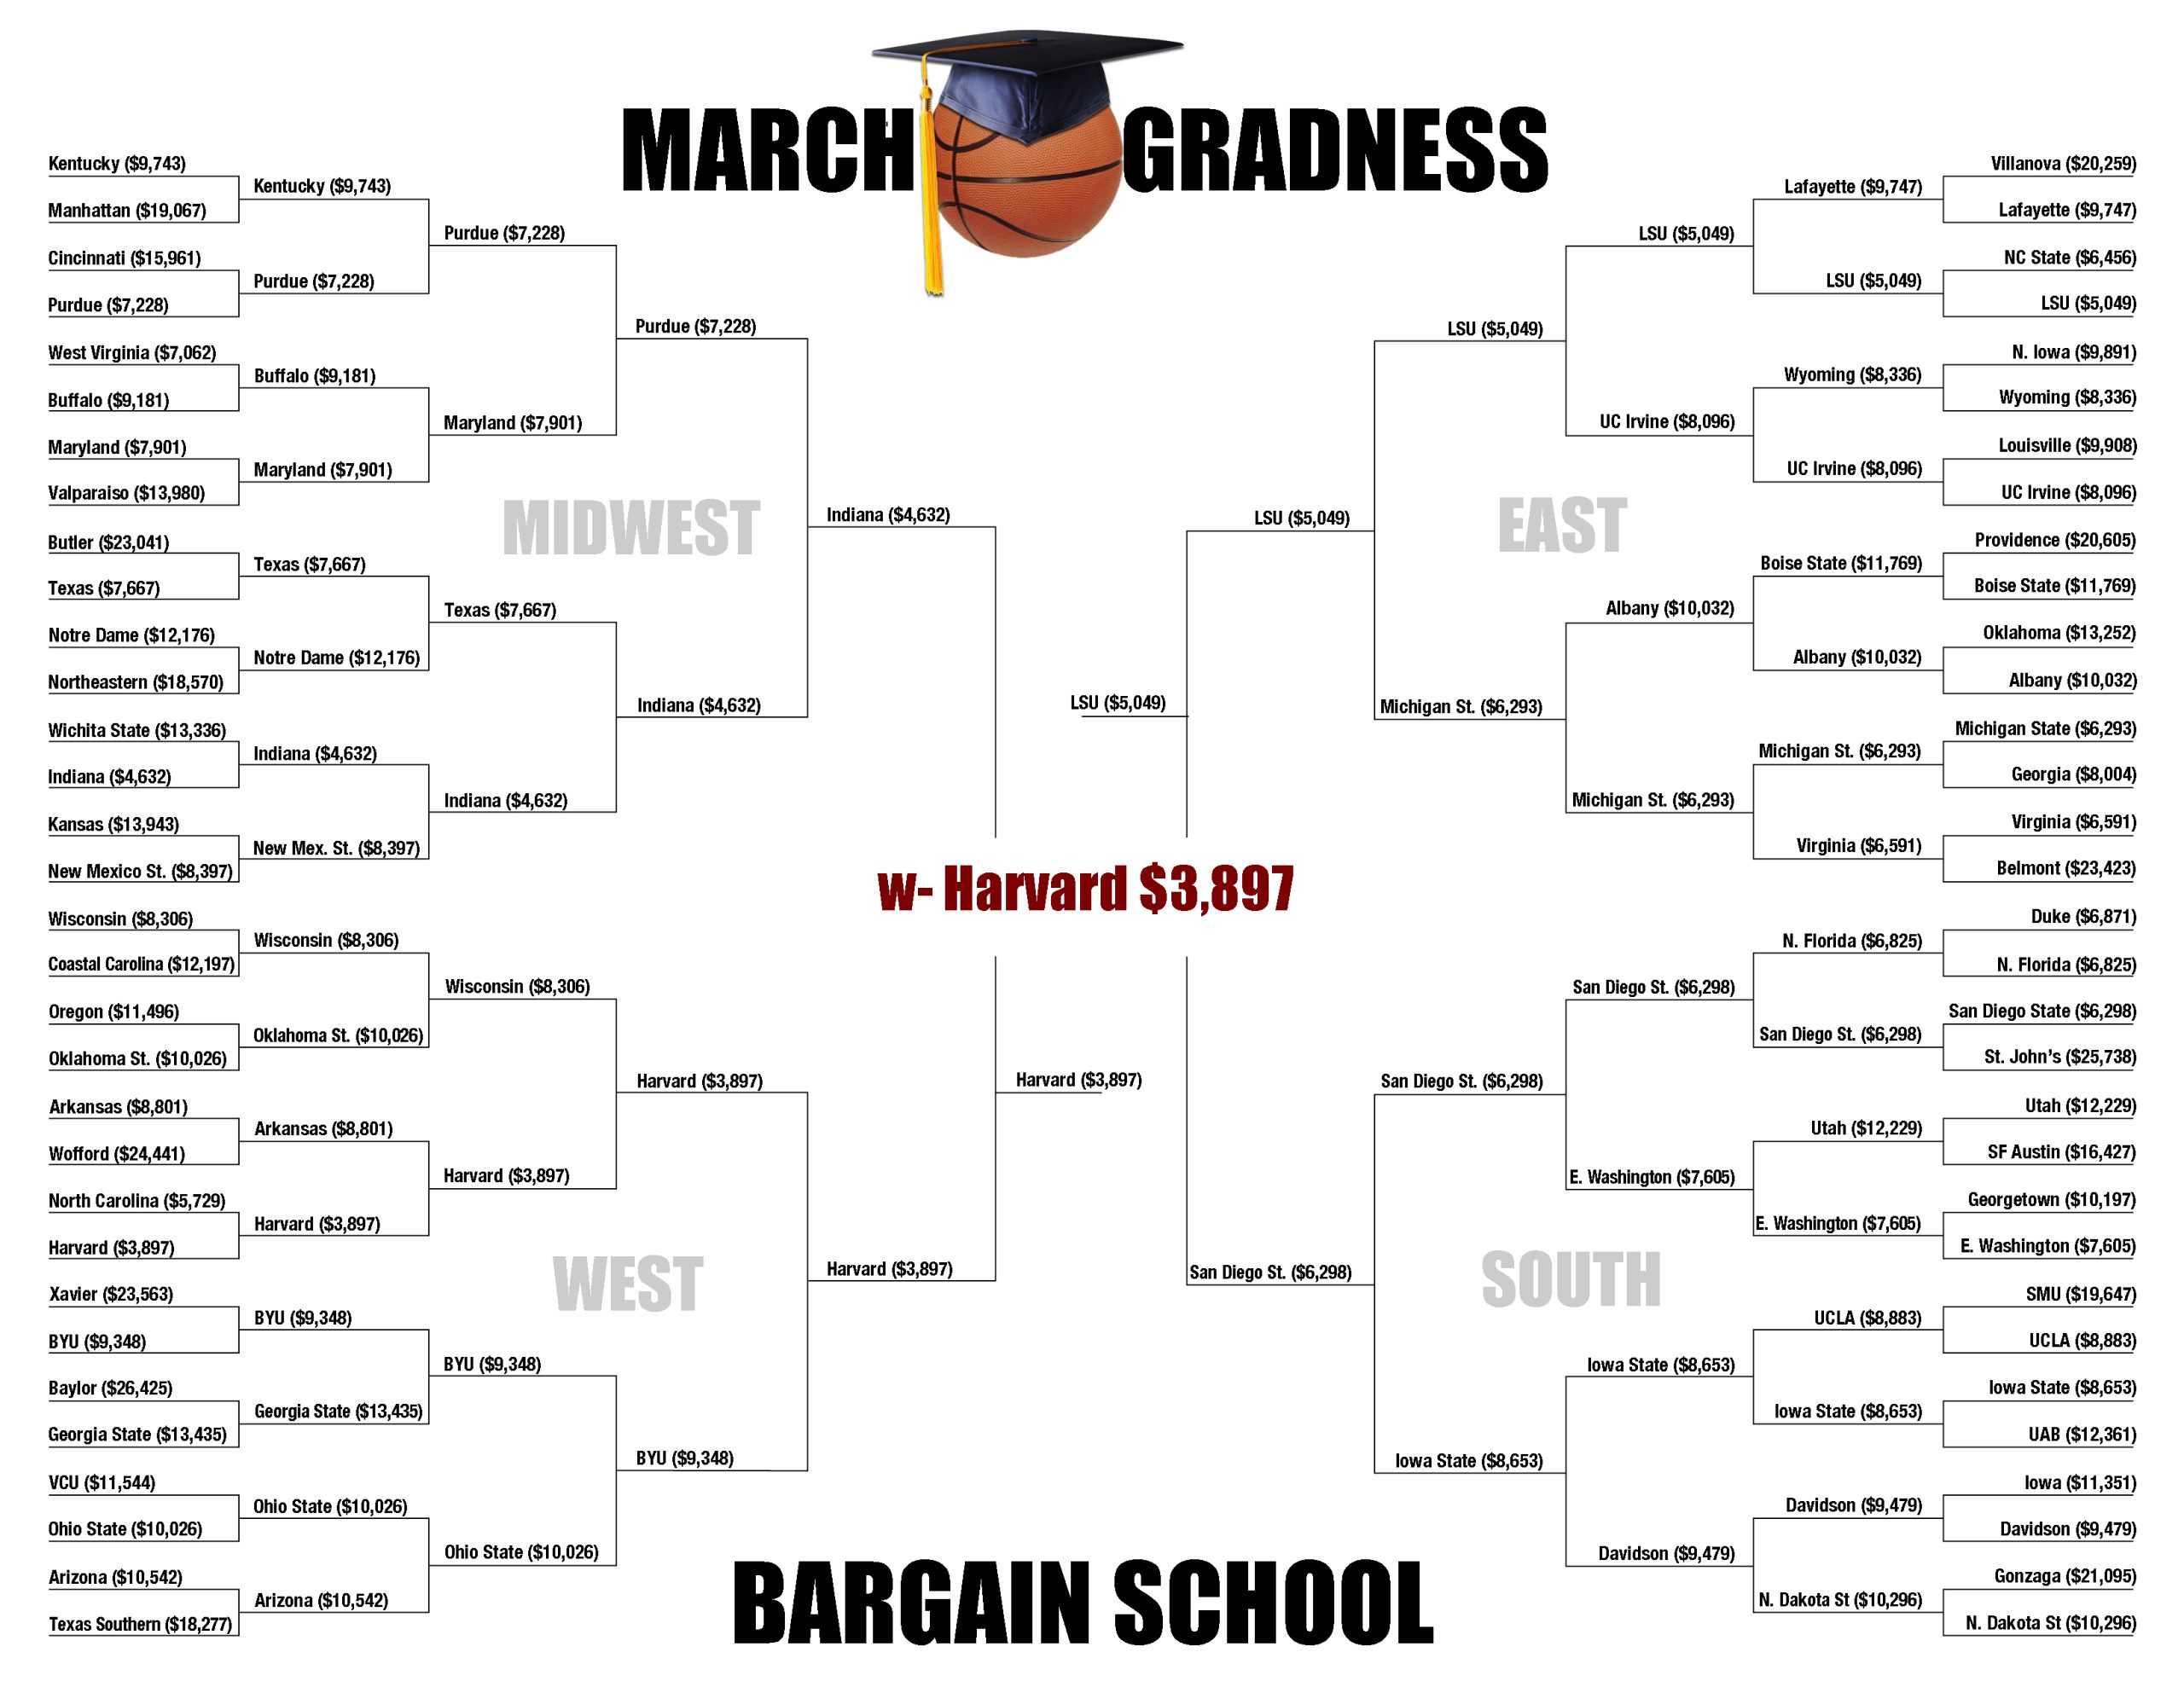
MSU does a lot better when games are decided by a school’s financial generosity to needy students. When considering the lowest average net cost for students with family incomes under $30,000, the Spartans make the Elite Eight. Low-income families with students attending MSU pay only $6,293 on average after financial aid is awarded. Harvard ($3,897) wins this bracket, too, defeating LSU ($5,049) in the championship game.
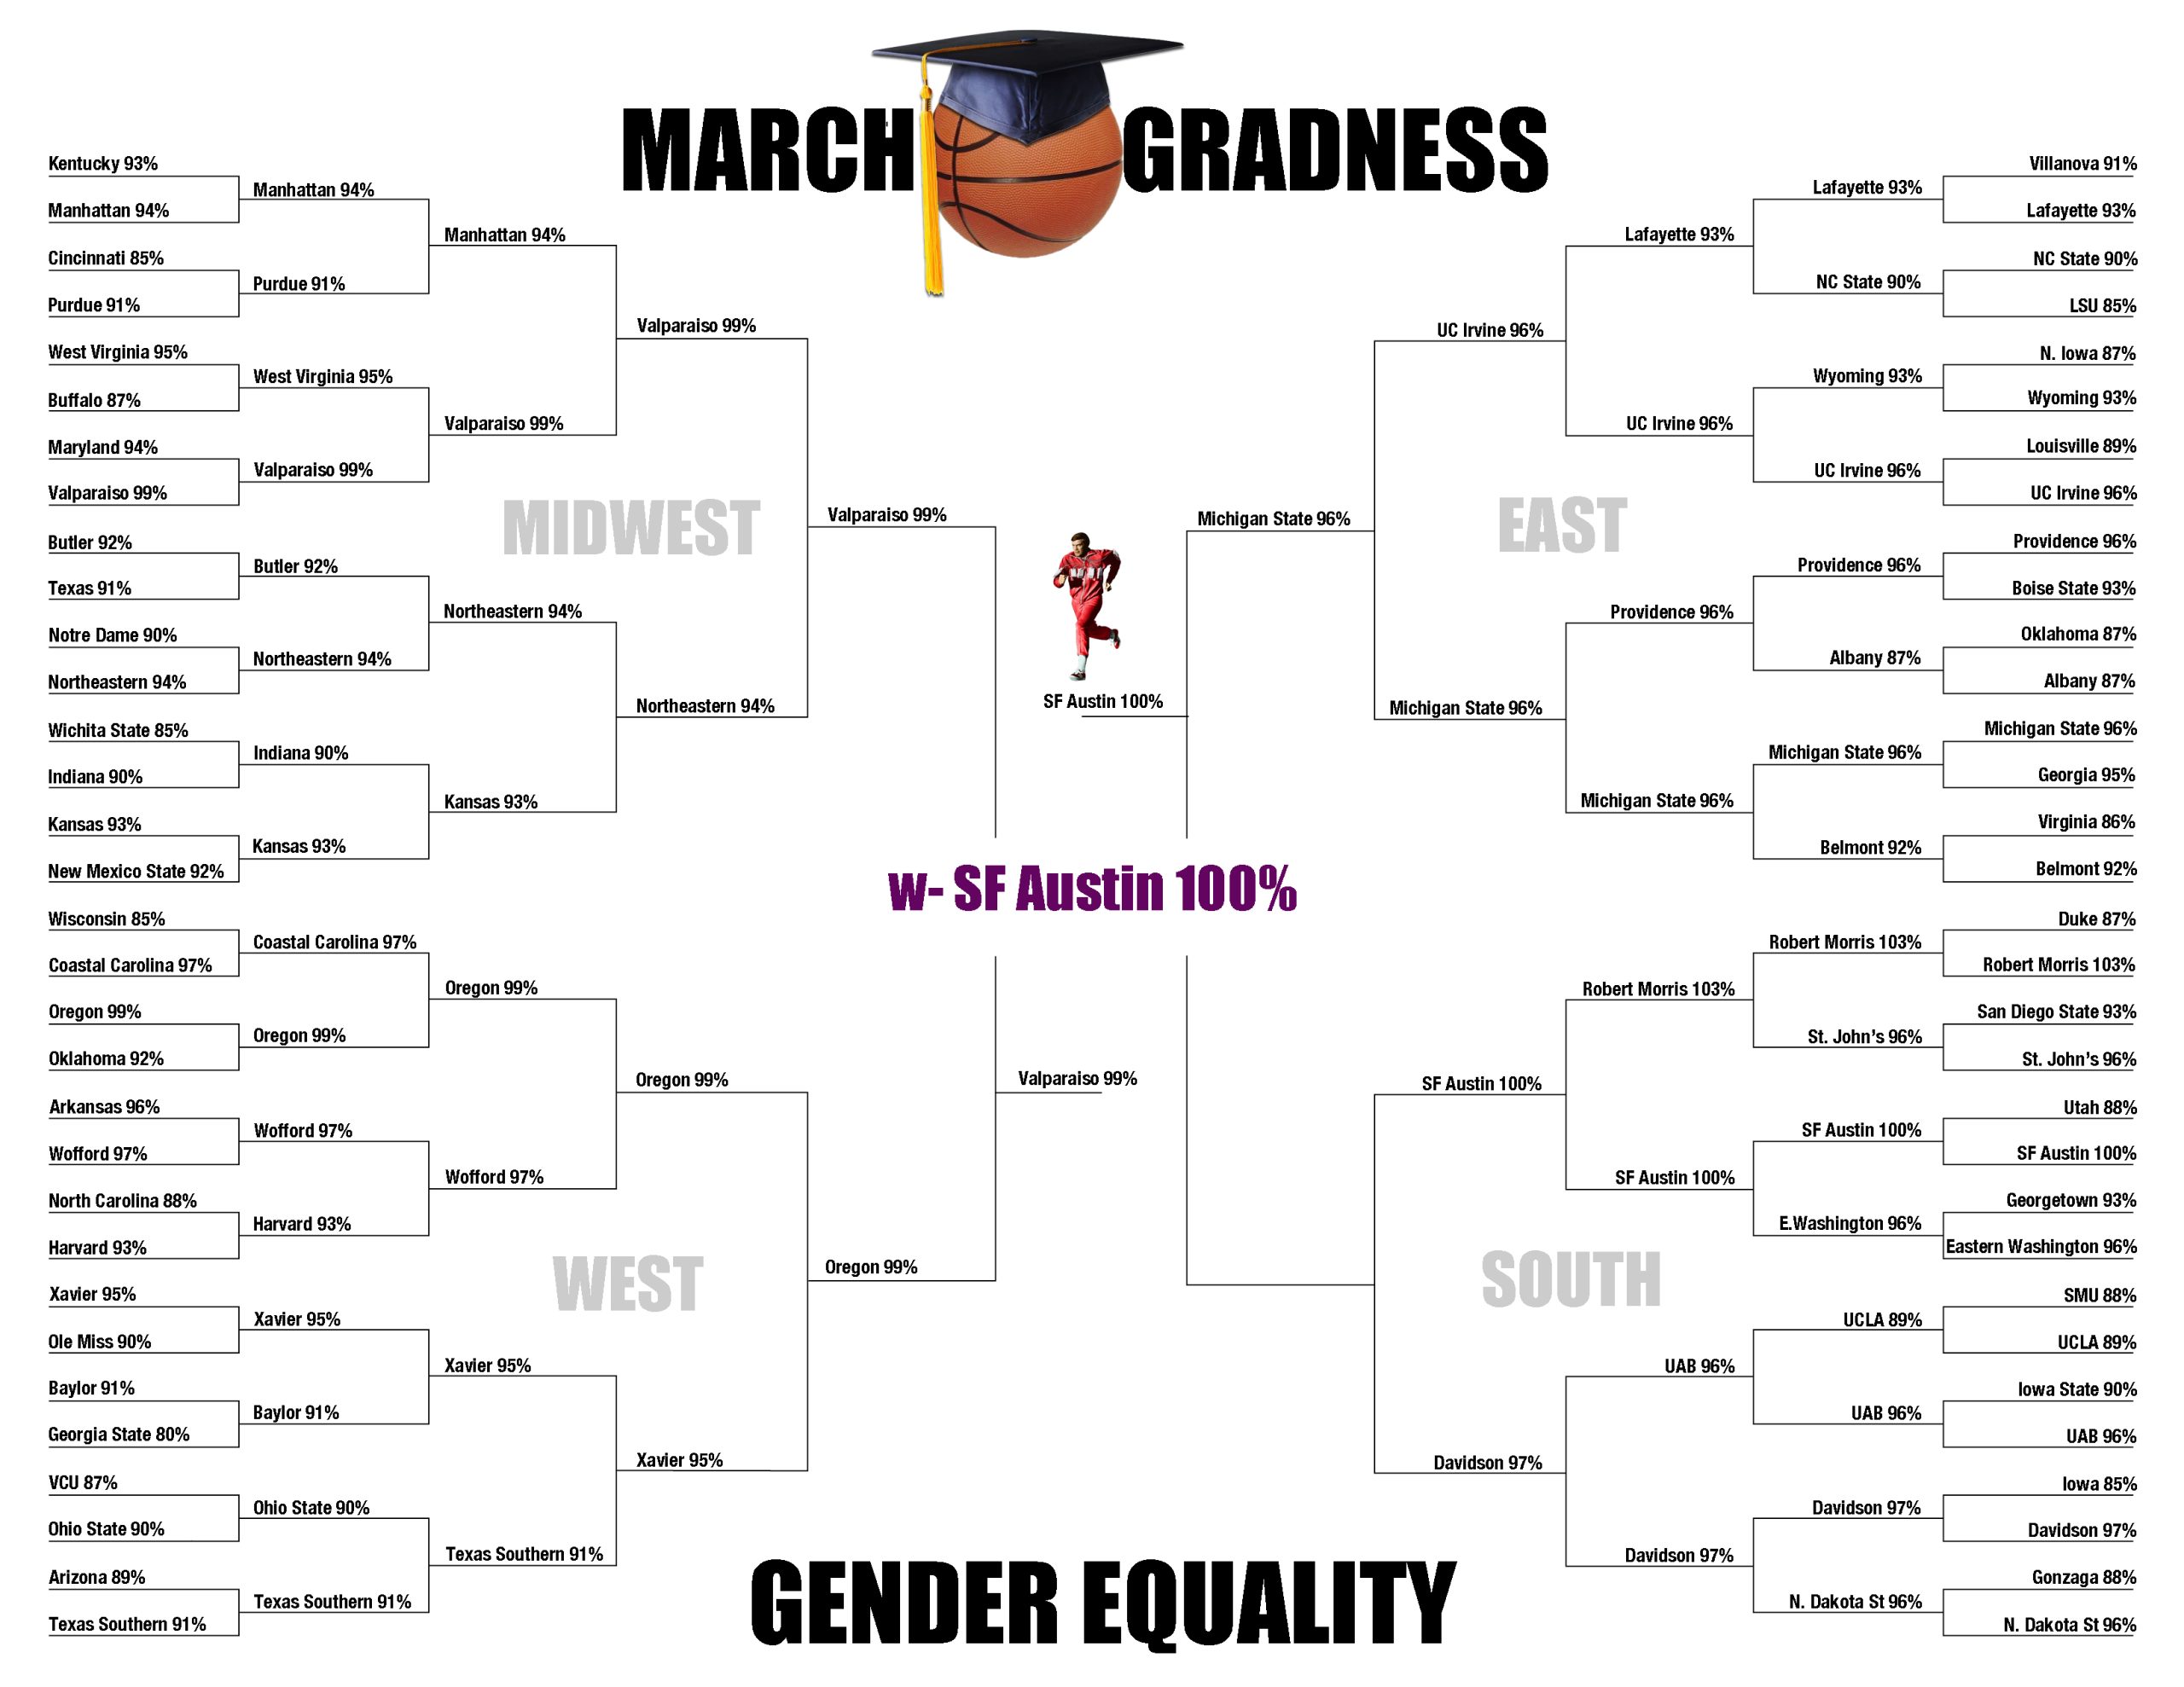
In the Gender Equity Bracket, Bridge compared the average salaries of male and female professors. The champion is named for a man, but is the only school with equal salaries for men and women, Stephen F. Austin State University in Nacogdoches, Texas.
Check all the brackets below. We wouldn’t recommend you use them in your office pool, but we also don’t recommend choosing a college based on the quality of their basketball team.
 Here’s how the NCAA Men’s Basketball Tournament would play out if games were decided by graduation rate. The figures represent the percentage of students who earn a bachelor’s degree within six years. Ties were broken by awarding the victory to the school with the lowest net cost for low-income families.
 Here’s how the NCAA Men’s Basketball Tournament would play out if games were decided by which schools were the most affordable for low-income students. The figures are average net cost for students with family incomes under $30,000.
 Here’s how the NCAA Men’s Basketball Tournament would play out if the games were decided by which schools paid their women and men professors most equally. The figures represent the percentage of average salary for female professors compared the average salary of male professors. Ties were broken by going to additional decimal places.
Thank you to our Education Watch sponsors


Bridge Michigan Education Watch is made possible by generous financial support from our sponsors. Sponsorship supports our independent journalism mission but does not constitute sponsor endorsement of individual articles or editorial content. Bridge Michigan journalism remains fact- and data-driven and independent at all times.
Please visit the About page for more information and to subscribe to Education Watch. Interested in becoming a sponsor? Contact Emma Carr.
![]()


You must be logged in to post a comment.